AI Visibility overview
Your at-a-glance view of how visible your brand is across AI answers.
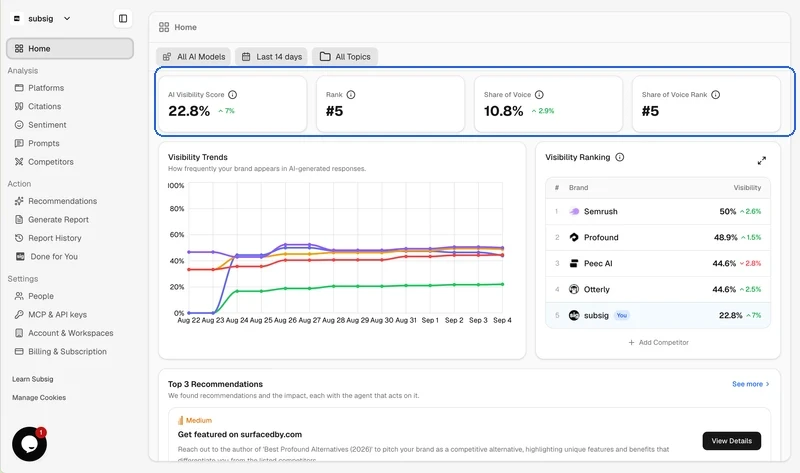
This is home base. Up top you'll find your headline numbers: your visibility score, your rank, and how they've shifted over the period you're looking at.
Use the filters in the top right to focus on a specific date range or a single AI platform. Whatever you pick applies to the whole report.
Recommendations from your AI agent
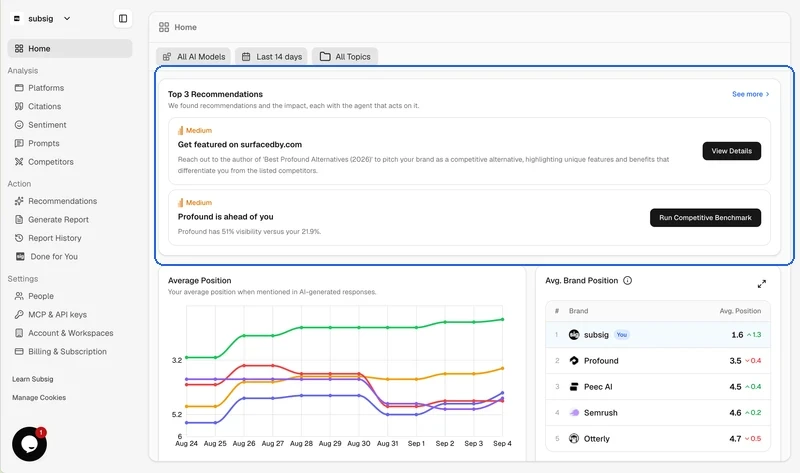
Your AI agent doesn't just show you numbers, it tells you what to do about them. The recommendations here are concrete next steps for showing up more often, and in a better light.
Trends over time
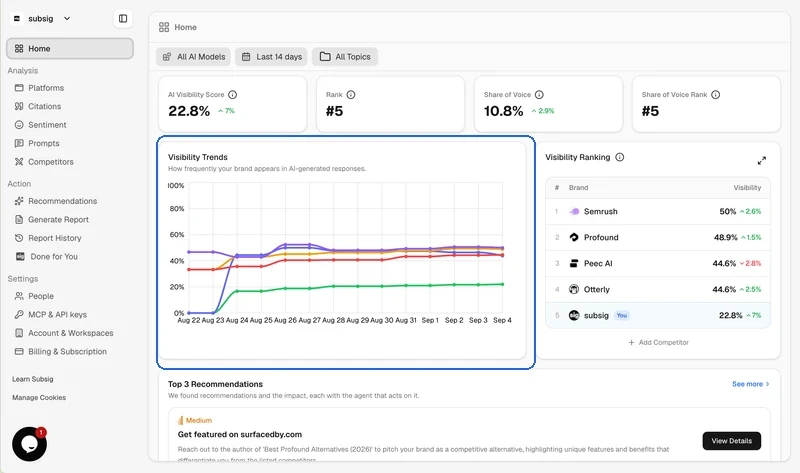
The visibility trend chart is where your work shows up. Watch it climb as things improve, and catch any dips before they turn into a problem.
You vs a competitor
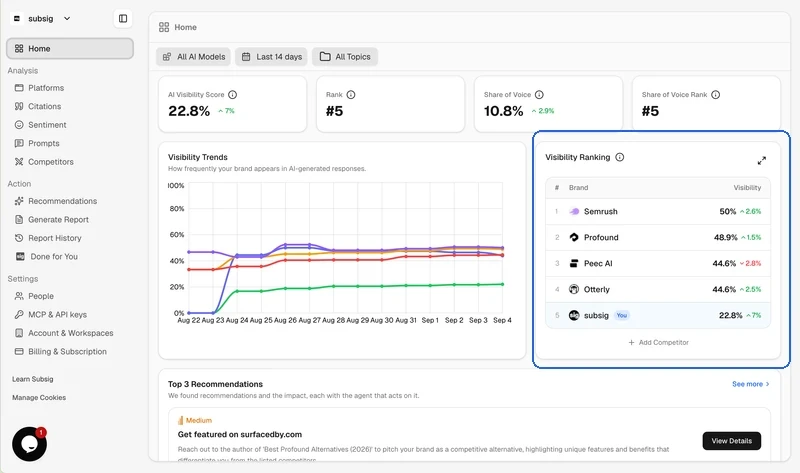
Lay a competitor's line over yours to see exactly where you're ahead and where you've got ground to make up.
Average Brand Position
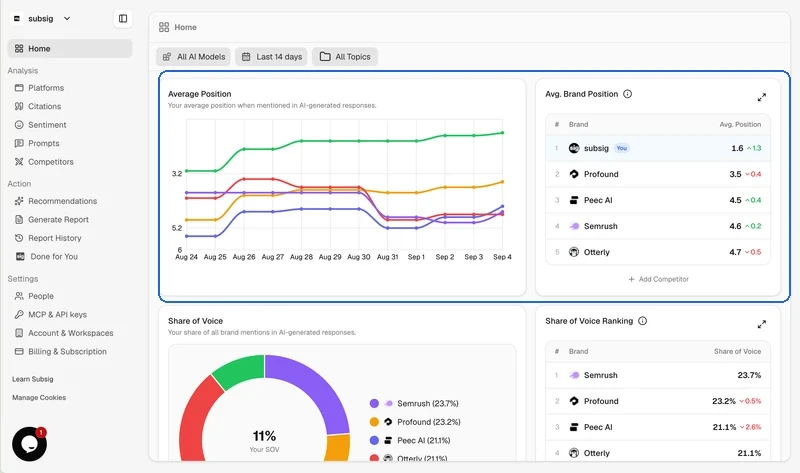
This one answers a simple question: on average, where do you land against everyone else across all your prompts?
Share of Voice
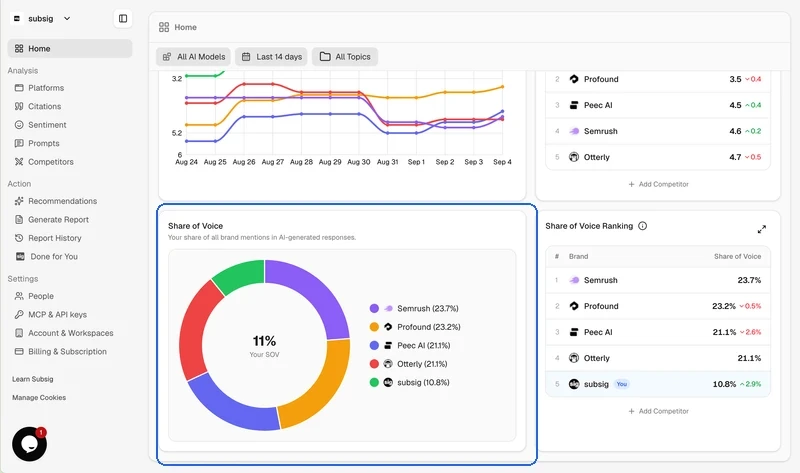
Share of Voice is the slice of AI answers that belongs to you rather than your competitors. It's one number for how much of the conversation you own.
💡 If your visibility is climbing but your share of voice is flat, the whole category is probably growing. Worth a look at which prompts are pulling the weight.